Processes and System Performance
The following table describes terms related to processes.
Table 22-1 Process Terminology
Term | Description |
|---|---|
Process | Any system activity or job. Each time you boot a system, execute a command, or start an application, the system activates one or more processes. |
Lightweight process (LWP) | A virtual CPU or execution resource. LWPs are scheduled by the kernel to use available CPU resources based on their scheduling class and priority. LWPs include a kernel thread and an LWP. A kernel thread contains information that has to be in memory all the time. An LWP contains information that is swappable. |
Application thread | A series of instructions with a separate stack that can execute independently in a user's address space. They can be multiplexed on top of LWPs. |
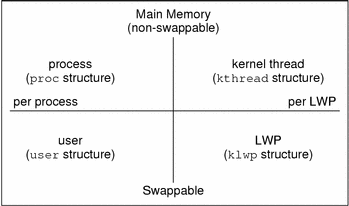
A process can consist of multiple LWPs and multiple application threads. The kernel schedules a kernel-thread structure, which is the scheduling entity in the SunOS environment. Various process structures are described in the following table.
Table 22-2 Process Structures
Structure | Description |
|---|---|
proc | Contains information that pertains to the whole process and must be in main memory all the time. |
kthread | Contains information that pertains to one LWP and must be in main memory all the time. |
user | Contains the "per process" information that is swappable. |
klwp | Contains the "per LWP process" information that is swappable. |
The following figure illustrates the relationship of these process structures.
Figure 22-1 Process Structures

Most process resources are accessible to all the threads in the process. Almost all process virtual memory is shared. A change in shared data by one thread is available to the other threads in the process.
About Monitoring Performance
While your computer is running, counters in the operating system are incremented to track various system activities. System activities that are tracked are as follows:
Central processing unit (CPU) utilization
Buffer usage
Disk and tape input/output (I/O) activity
Terminal device activity
System call activity
Context switching
File access
Queue activity
Kernel tables
Interprocess communication
Paging
Free memory and swap space
Kernel Memory Allocation (KMA)
Monitoring Tools
The Solaris software provides several tools to help you track how your system is performing. The following table describes these tools.
Table 22-3 Performance Monitoring Tools
Command | Description | For More Information |
|---|---|---|
sar and sadc commands | Collects and reports on system activity data | |
ps and prstat commands | Displays information about active processes | |
vmstat and iostat commands | Summarizes system activity data, such as virtual memory statistics, disk usage, and CPU activity | |
swap command | Displays information about available swap space on your system | "Configuring Additional Swap Space (Tasks)" in System Administration Guide: Basic Administration |
netstat and nfsstat commands | Displays information about network performance | netstat(1M) and nfsstat(1M) |
Sun Enterprise SyMON | Collects system activity data on Sun's Enterprise level systems | Sun Enterprise SyMON 2.0.1 Software User's Guide |


