 To Change the Orientation of the Charts
By default, Performance Meter displays the performance charts horizontally (side-by-side). Depending on the number of parameters you monitor and the available space on your desktop, you may want to display them vertically.
Choose Setup from the Options menu.
Performance Meter displays the Setup dialog box.
Select Vertical or Horizontal to specify the type of chart required.
(Optional) Select the Show Limit Line checkbox if you want your charts to indicate the threshold value using a line.
Click Apply when you are satisfied with the changes you have made.
Performance Meter displays the performance information in the specified orientation.
 To Choose Line Charts or Area Charts
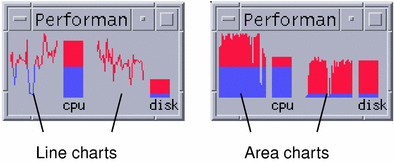
The optional chart displayed for each parameter can be one of the following types:
A line chart (the default), which represents activity using a continuous line
An area chart, which is the same as a line chart but with the area between the line and the horizontal axis filled

Choose Setup from the Options menu.
Performance Meter displays the Setup dialog box.
Select the Solid choice button for area charts or the Line choice button for line charts.
(Optional) Select the Show Limit Line checkbox if you want your charts to indicate the threshold value using a line.
Click Apply when you are satisfied with the changes you have made.
Performance Meter displays the information using the specified charts.
Working With Colors and Thresholds
Performance Meter uses colors and thresholds to help you differentiate between activity that you consider normal and activity that you consider exceptional. If a parameter exceeds a threshold value, the exceptional value is displayed using a different color. By default, values less than the default thresholds are displayed in blue and values exceeding the default thresholds are displayed in red.
The Setup dialog box enables you to change the colors and threshold values.
Tip - Be consistent in your use of colors: if red means "warning" for one parameter, then it should mean the same for the other.
If you do not know an appropriate threshold value for a parameter, consider using the same color for both "above" and "below" so that you are only monitoring activity.
 To Change Chart Colors
Choose Setup from the Options menu.
Performance Meter displays the Setup dialog box. For each parameter, color selectors enable you to choose the colors for values above and values below the current threshold.
Press mouse button 1 on any of the color selectors and choose a new color.
Click Apply when you are satisfied with the changes you have made.
Performance Meter applies the new colors to the display.
 To Change the Threshold Value for a Parameter
Choose Setup from the Options menu.
Performance Meter displays the Setup dialog box which contains a Threshold box for each parameter.
Type a new threshold value for the relevant parameter and click Apply.
Values below the new threshold value are now displayed using the color selected for below, and values above this threshold value are now displayed in the color selected for above.
Table 20-1 Default Threshold Settings
| Parameter | Default Threshold Value |
|---|---|
| CPU | 50% |
| Load | 2 per second |
| Disk | 20 per second |
| Page | 8 per second |
| Context | 32 per second |
| Swap | 2 per second |
| Interrupts | 50 per second |
| Packets | 16 per second |
| Collisions | 2 per second |
| Errors | 2 per second |
Logging Samples and Choosing the Sample Interval
By default, Performance Meter samples the activity on the workstation every 2 seconds, and creates a log file containing details of the initial sample only. You can change this sample interval and choose to continually add the sample information to a log file.
 To Save Sample Information to a Log File
Choose Setup from the Options menu.
Performance Meter displays the Setup dialog box.
Select the Log Samples In checkbox.
Type the name of your log file in the Log Samples In text box.
Use a descriptive name such as the default samples, or if you are monitoring multiple hosts from your workstation: samples_hostname.
The default location is your home folder, such as /home/fredj/samples.
Click Apply to make your changes take effect.
Performance Meter creates the specified log file (a text file) if it doesn't exist. Performance Meter continues to append sample details for each sample until you exit Performance Meter. The next time you run Performance Meter, the Log Samples In checkbox will be unselected.


