Debugger Concepts
This section discusses the significant aspects of MDB's design, and the benefits derived from this architecture.
Architecture
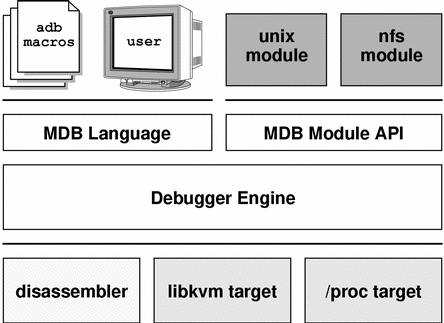
Figure 2-1 MDB architecture

Building Blocks
The target is the program being inspected by the debugger. MDB currently provides support for the following types of targets:
User processes
User process core files
Live operating system (through /dev/kmem and /dev/ksyms)
Operating system crash dumps
User process images recorded inside an operating system crash dump
ELF object files
Raw data files
Each target exports a standard set of properties, including one or more address spaces, one or more symbol tables, a set of load objects, and a set of threads. Figure 2-1 shows an overview of the MDB architecture, including two of the built-in targets and a pair of sample modules.
A debugger command, or dcmd (pronounced dee-command) in MDB terminology, is a routine in the debugger that can access any of the properties of the current target. MDB parses commands from standard input, then executes the corresponding dcmds. Each dcmd can also accept a list of string or numerical arguments, as shown in "Syntax". MDB contains a set of built-in dcmds described in Chapter 5, Built-in Commands, that are always available. The programmer can also extend the capabilities of MDB itself by writing dcmds using a programming API provided with MDB.
A walker is a set of routines that describe how to walk, or iterate, through the elements of a particular program data structure. A walker encapsulates the data structure's implementation from dcmds and from MDB itself. You can use walkers interactively, or use them as a primitive to build other dcmds or walkers. As with dcmds, the programmer can extend MDB by implementing additional walkers as part of a debugger module.
A debugger module, or dmod (pronounced dee-mod), is a dynamically loaded library containing a set of dcmds and walkers. During initialization, MDB attempts to load dmods corresponding to the load objects present in the target. You can subsequently load or unload dmods at any time while running MDB. MDB provides a set of standard dmods for debugging the Solaris kernel.
A macro file is a text file containing a set of commands to execute. Macro files are typically used to automate the process of displaying a simple data structure. MDB provides complete backward compatibility for the execution of macro files written for adb. The set of macro files provided with the Solaris installation can therefore be used with either tool.
Modularity
The benefit of MDB's modular architecture extends beyond the ability to load a shared library containing additional debugger commands. The MDB architecture defines clear interface boundaries between each of the layers shown in Figure 2-1. Macro files execute commands written in the MDB or adb language. Dcmds and walkers in debugger modules are written using the MDB Module API, and this forms the basis of an application binary interface that allows the debugger and its modules to evolve independently.
The MDB name space of walkers and dcmds also defines a second set of layers between debugging code that maximizes code sharing and limits the amount of code that must be modified as the target program itself evolves. For example, one of the primary data structures in the Solaris kernel is the list of proc_t structures representing active processes in the system. The ::ps dcmd must iterate over this list in order to produce its output. However, the code to iterate over the list is not in the ::ps dcmd, it is encapsulated in the genunix module's proc walker.
MDB provides both ::ps and ::ptree dcmds, but neither has any knowledge of how proc_t structures are accessed in the kernel. Instead, they invoke the proc walker programmatically and format the set of returned structures appropriately. If the data structure used for proc_t structures ever changed, MDB could provide a new proc walker and none of the dependent dcmds would need to change. The proc walker can also be accessed interactively using the ::walk dcmd in order to create novel commands as you work during a debugging session.
In addition to facilitating layering and code sharing, the MDB Module API provides dcmds and walkers with a single stable interface for accessing various properties of the underlying target. The same API functions are used to access information from user process or kernel targets, simplifying the task of developing new debugging facilities.
In addition, a custom MDB module can be used to perform debugging tasks in a variety of contexts. For example, you might want to develop an MDB module for a user program you are developing. Once you have done so, you can use this module when MDB examines a live process executing your program, a core dump of your program, or even a kernel crash dump taken on a system where your program was executing.
The Module API provides facilities for accessing the following target properties:
| Address Spaces | The module API provides facilities for reading and writing data from the target's virtual address space. Functions for reading and writing using physical addresses are also provided for kernel debugging modules. |
| Symbol Tables | The module API provides access to the static and dynamic symbol tables of the target's primary executable file, its runtime link-editor, and a set of load objects (shared libraries in a user process or loadable modules in the Solaris kernel). |
| External Data | The module API provides a facility for retrieving a collection of named external data buffers associated with the target. For example, MDB provides programmatic access to the proc(4) structures associated with a user process or user core file target. |
In addition, you can use built-in MDB dcmds to access information about target memory mappings, load objects, register values, and control the execution of user process targets.


