| C H A P T E R 6 |
Thermal Conditions Administration |
This chapter describes how to administer the thermal conditions and fans from within Hostview and how to monitor and control the fans from within Hostview.
You can use Hostview to monitor thermal conditions for power supplies, processors, ASICs, and other sensors located on system boards, support boards, controller boards, and the centerplane.
1. Click the Temperature button.

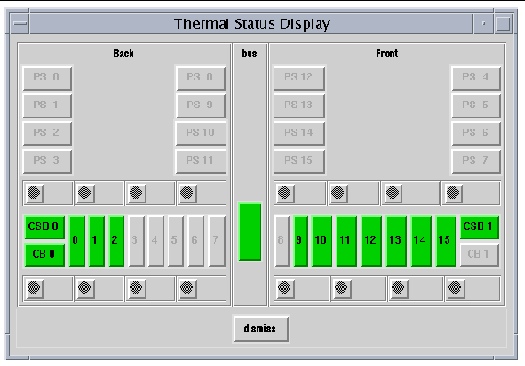
The Thermal Status Display window is displayed ( FIGURE 6-2 ). If you do not have the dual grid power option for the Sun Enterprise 10000 system, you will see 8 power supplies instead of 16.

The centerplane, support boards, control boards, and system boards are shown in green if their temperatures are in the normal range, and in red otherwise.
2. Click a component with the left mouse button to see the thermal details about that component.
The Thermal Detail window for that component is displayed ( FIGURE 6-3 ).

The left panel of the system board detail shows the temperatures for the five ASICs, named A0 through A4. The middle panel shows the temperatures for the three power supplies. The right panel shows the temperatures for the four processors, named P0 through P3.
The temperatures are displayed in degrees centigrade, and the values are shown numerically and as vertical bars. The vertical bars are colored green if the temperature is within the normal range, and red otherwise. The bars never grow taller than the height of the window, so temperature levels above the maximum threshold are displayed as red maximum-height bars. Similarly, bars never shrink below a minimum height, so temperature levels below the minimum threshold are displayed as red minimum-height bars.
The detail windows for control boards, support boards, and the center plane are similar.
You can use Hostview to monitor fan speeds and fan failures for the 32 fans located throughout the Sun Enterprise 10000 platform.

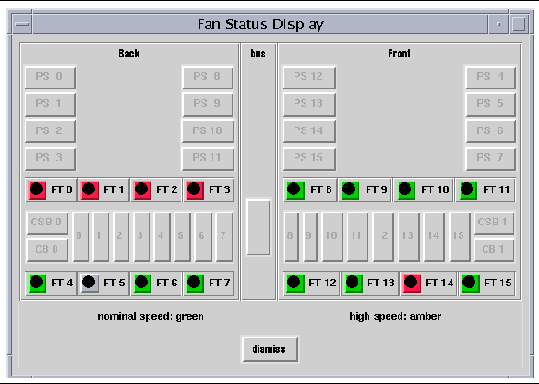
The Fan Status Display window is displayed ( FIGURE 6-5 ). If you do not have the Sun Enterprise 10000 dual grid power option, you will see 8 power supplies instead of 16.

The fan trays are named FT0 through FT7 on the back, and FT8 through FT15 on the front. Each fan tray contains two fans. The color of the fan tray symbol is green if both fans in the tray are functioning at normal speed, amber if both fans are functioning at high speed, and red if either fan within the fan tray has failed.
2. Click a fan tray symbol with the left mouse button to see a detail window about that fan.
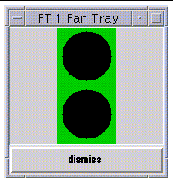
The Fan Tray window is displayed ( FIGURE 6-6 ).

The top circle indicates the inner fan when you open the fan tray, and the lower circle indicates the outer fan. The color surrounding each circle in the fan detail indicates the status of that fan. The colors are green for normal operation at normal speed, amber for normal operation at high speed, and red for failure.
Copyright © 2002, Sun Microsystems, Inc. All rights reserved.