| C H A P T E R 2 |
Hostview |
This chapter describes Hostview, a GUI front-end to SSP commands.
Hostview enables you to perform administration operations such as:
Dynamically grouping the system boards into domains. Each domain runs its own instance of the Solaris operating environment and has its own log messages file.
Booting the Solaris operating environment for a domain.
Accessing the SSP log messages file for each platform or domain.
Remotely logging in to each domain.
Displaying a netcon (1M) window for each domain.
Editing the blacklist (4) file to enable or disable hardware components in a domain.
Dynamically reconfiguring the boards within a platform, logically attaching or detaching them from the operating system. This feature is described in the Sun Enterprise 10000 Dynamic Reconfiguration User Guide .
Powering the system boards on and off.
Monitoring the temperature and voltage levels of hardware components.
If you want to run Hostview, you only need to run one instance for a given platform. However, it is possible to run more than one instance simultaneously (perhaps on different workstations) to work with the same platform.
If you have logged into the SSP environment from a remote login session, make sure your DISPLAY environment variable is set to your current display and that your xhost settings enable the SSP to display on your workstation (see xhost (1) in the Solaris X Window System Reference Manual ).
1. Enable external hosts to display on your local workstation:
2. Log in to the SSP as user ssp and type :
|
|
 From the Workspace Menu (right mouse button click), select SSP, and then select Hostview.
This is available only when you use the SSP console, not when you use a remote login session to the SSP.
 Use one of the following methods:
Click the SSP icon on the front panel. The icon shows a hand holding tools.
Click the arrow above the SSP icon on the front panel, and select Hostview.
Open an SSP window and type:
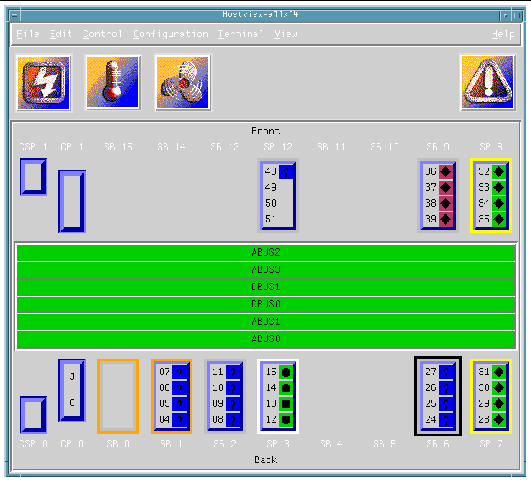
When you start Hostview, the main window is displayed ( FIGURE 2-1 ).

The menu bar on the main window provides the commands that you use to control the platform. The commands are described in Main Window Menu Bar .
The buttons on the main window (Power, Temperature, and Fans) bring up status details. The buttons are described in Main Window Buttons .
The rest of the main window provides a graphical view of the platform boards and buses. The system boards are named SB0 through SB15, and their processor numbers are shown. The control boards are named CB0 and CB1. The support boards are named CSB0 and CSB1. The buses are named ABUS0 through ABUS3, DBUS0, and DBUS1.
The system boards along the top of the display are arranged in the order they appear on the front side of the physical platform. The system boards along the bottom of the display are arranged in the order they appear on the back side of the physical platform.
If a system board is shown with no outline ( FIGURE 2-2 ), the board is not part of a domain and is not currently selected.

If a system board is part of a domain ( FIGURE 2-3 ), a colored outline surrounds it. The boards within a given domain all have outlines of the same color.

A black outline around the domain color outline indicates that a board is selected ( FIGURE 2-4 ). (There are several reasons why you select a board in Hostview. For example, you could select one or more boards, and then create a domain that is based on those boards.)

The processors within the boards are numbered 0 through 63. The processor symbols (diamond, circle, and so forth) indicate the state of the processors and are described in Main Window Processor Symbols .
You can select one or more boards in the Hostview main window. You can also select one domain in the main window. You must select a set of boards prior to performing certain operations, such as creating a domain.
To select a single board, click on it with the left mouse button. The selected board is indicated by a black outline, and all other boards are deselected.
To select additional boards, click on them with the middle mouse button. You can also deselect a currently selected board by clicking on it with the middle mouse button. (The middle mouse button toggles the selection status of the board without affecting the selection status of any other board.)
To select a domain, click on a board within that domain with the left mouse button. Note that you can select boards from different domains (using the middle mouse button), but the selected domain will correspond to the board that you selected with the left mouse button.
The items on the main Hostview menu are described in .
|
Displays a window that shows the SSP messages for a domain or for the platform. For more information, see SSP Log Files . |
||
|
Displays a window that enables you to use the power (1M) command. See To Power Components On or Off From Within Hostview . |
||
|
Displays a window that enables you to run bringup (1M) on a domain. See To Bring up a Domain From Within Hostview . |
||
|
Displays a window that enables you to run the fan (1M) command to control the fans within the platform. |
||
|
Enables you to attach and detach system boards. This feature is described in the Sun Enterprise 10000 Dynamic Reconfiguration User Guide. |
||
|
Provides a menu with several choices. The menu choices enable you to create domains, remove domains, rename domains, obtain the status of domains, and view the history of domains. A domain consists of one or more system boards running the same operating system kernel. Domains function independently of each other. Each domain can carry its own workload and has its own log messages file. For more information, see To Create Domains From Within Hostview and To Remove Domains From Within Hostview . |
||
|
Displays a window that provides a graphical interface to the netcon (1M) command, enabling you to open a network console window for a domain. This menu item is equivalent to executing the netcontool (1M) command. See Using netcon(1M) . |
||
|
Provides menu choices that enable you to display an SSP Window in xterm , dtterm , cmdtool , or shelltool format with a platform or domain as its host. Select a domain (by selecting any system board within that domain) before choosing this option. |
||
|
Provides menu choices that enable you to remotely log in to the selected platform or domain in an xterm , dtterm , cmdtool , or shelltool window. Select a domain (by selecting any system board within that domain) before choosing this option. |
||
|
Displays the boards within all domains, as well as any boards that are not part of a domain. (A board can be present without being part of a domain, although a board cannot be used when it is not part of a domain.) |
||
|
When you select an individual domain, only the boards within that domain are displayed. Note that the color of the outline used to designate a given domain is also used as the background color for that domain in the menu. The system board numbers for the boards that belong to each domain are shown in square brackets. |
||
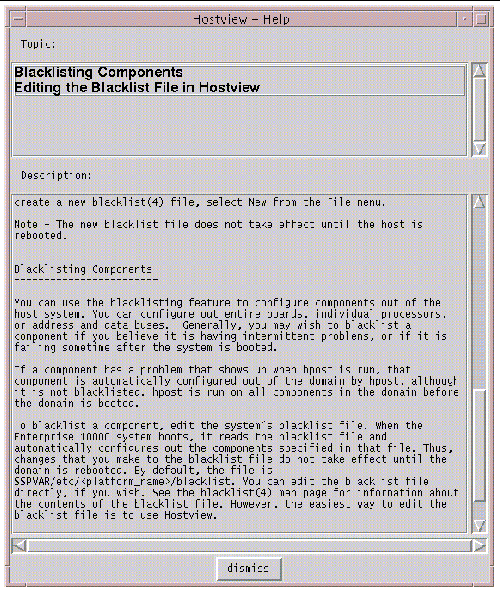
When you choose a topic from the Help menu, the Hostview - Help window is displayed ( FIGURE 2-5 ).

You can select the desired topic in the upper pane. The corresponding help information is displayed in the lower pane.
The main Hostview window contains the buttons described below. If an out-of-boundary condition exists or an error has occurred, one or more of these buttons turn red.
The Power button ( FIGURE 2-6 ) displays the Power Control and Status window, which enables you to view the power status for the platform. See To Power Components On or Off From Within Hostview .

The Temperature button ( FIGURE 2-7 ) displays the Thermal Status window, which enables you to view the temperature status for the boards and components within the platform. See To Monitor Thermal Conditions From Within Hostview .

The Fan button ( FIGURE 2-8 ) displays the Fan Status window, which enables you to view the status of the fans within the platform. See To Monitor Fans From Within Hostview .

When certain error conditions occur, the Failure button ( FIGURE 2-9 ) turns red. If you click a red Failure button, a window is displayed showing the error condition(s) that have occurred.

describes the types of error conditions that are trapped by this mechanism.
In the main window, the shape and background color of a processor symbol indicate the status of that processor. For example, a diamond on a green background indicates the processor is running the operating system.
lists the shapes and what the processor is running for each shape.
lists the possible colors for processor symbols and the processor state indicated by each color.
In the Hostview main window, boards that are in the same domain have the same color outline. If you want to change the domain colors or if your workstation does not use the default colors supported by Hostview, you can configure the colors used for each domain. Put the following resources in your $HOME/.Xdefaults file and modify the specified colors using valid color names:
You can use the showrgb (1) command (for details on this command, see the Solaris X Window System Reference Manual ) to list the valid domain color names on your display workstation. If you specify an invalid domain color in the .Xdefaults file, an error is generated and the following occurs:
Domain outlines for the invalid color and subsequent domain colors are not displayed in the main Hostview window
Domain names are not listed in the View menu
Each instance of Hostview requires up to 10 Mbytes of the available swap space in the SSP. Before running multiple copies of Hostview, make sure the SSP has sufficient swap space available. For example, if you plan to run three instances of Hostview, make sure you have at least 30 Mbytes of swap space.
The SSP processes log, informational, warning, and error messages to a variety of log files.
Messages for the platform that are not specific to a domain are logged in the file:
If you have a spare SSP, note that messages logged in the platform message file on the main SSP and any domain messages are also logged on the spare SSP.
Messages for a particular domain are logged in the file:
where domain_name is the host name of the domain for which the error occurred.
The SSP environment variables, such as SSPLOGGER , are described in Environment Variables .
The message format and logging level are specified in the $SSPLOGGER/.logger and the /etc/syslog.conf files on the SSP. Do not change the default values in these files unless your service provider instructs you to do so.
1. Select the appropriate board.
If you want to view the messages file for a particular domain, select that domain in the main Hostview window (by clicking on a board from that domain with the left mouse button).
If you want to view the messages file for the platform, make sure that no domain is selected.
2. Choose SSP Logs from the File menu.
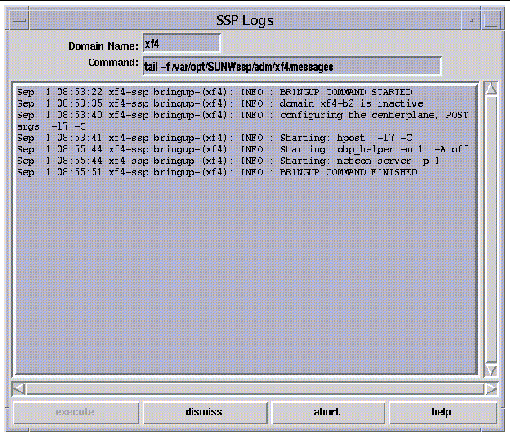
The SSP Logs window is displayed ( FIGURE 2-10 ).

The Domain Name field shows the name of the domain that you selected. The messages file is displayed in the main panel of the window.
Copyright © 2002, Sun Microsystems, Inc. All rights reserved.